

Note
Go to the end to download the full example code.
Extract tonal, transient, and noise components (Xtract)#
This example shows how to use the Xtract feature in PyAnsys Sound. It demonstrates the different capabilities of this feature, namely, noise extraction, tonal extraction, and transient extraction.
Set up analysis#
Setting up the analysis consists of loading the required libraries, connecting to the DPF server, and retrieving the example files.
# Load standard libraries.
import os

import matplotlib.pyplot as plt
import numpy as np

# Load Ansys libraries.
from ansys.sound.core import REFERENCE_ACOUSTIC_PRESSURE_IN_AIR
from ansys.sound.core.examples_helpers import (
    download_xtract_demo_signal_1_wav,
    download_xtract_demo_signal_2_wav,
)
from ansys.sound.core.server_helpers import connect_to_or_start_server
from ansys.sound.core.signal_utilities import CropSignal, LoadWav
from ansys.sound.core.spectrogram_processing import Stft
from ansys.sound.core.xtract import (
    Xtract,
    XtractDenoiser,
    XtractDenoiserParameters,
    XtractTonal,
    XtractTonalParameters,
    XtractTransient,
    XtractTransientParameters,
)


# Connect to a remote DPF server or start a local DPF server.
my_server, my_license_context = connect_to_or_start_server(use_license_context=True)
Load a demo signal for Xtract#
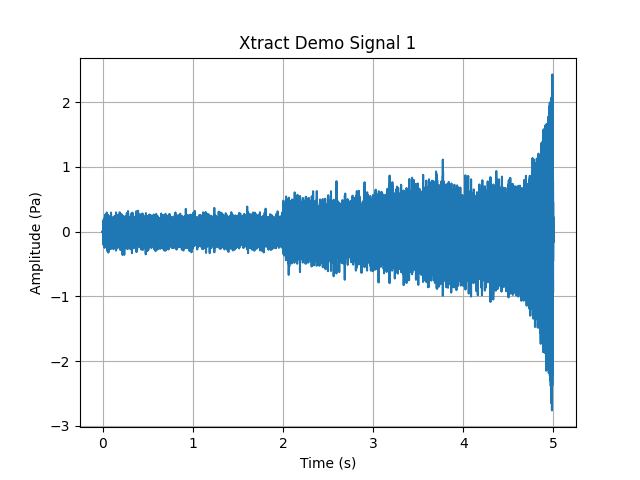
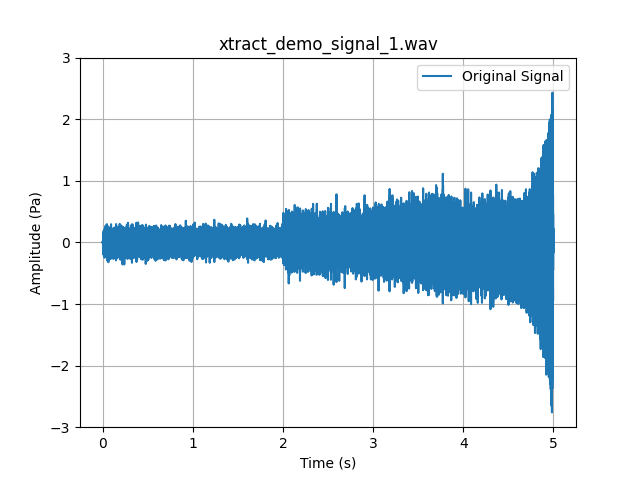
Load a demo signal from a WAV file using the LoadWav class.
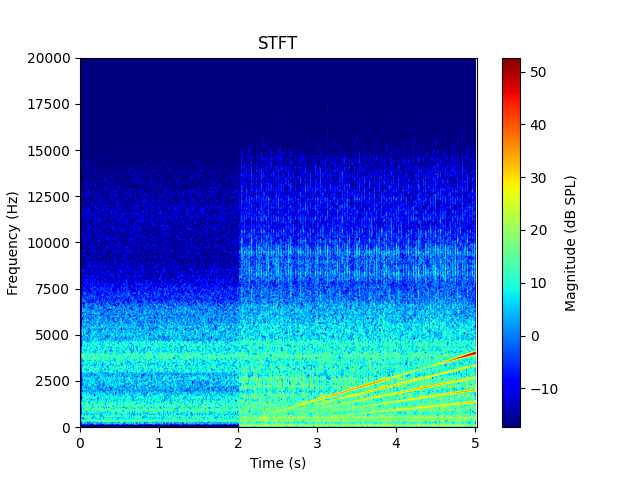
The WAV file contains harmonics and impact sound components.
# Return the input data of the example file.
path_xtract_demo_signal_1 = download_xtract_demo_signal_1_wav()

# Load the WAV file.
wav_loader = LoadWav(path_to_wav=path_xtract_demo_signal_1)
wav_loader.process()

# Plot the signal.
signal = wav_loader.get_output()[0]
fs = wav_loader.get_sampling_frequency()
time = signal.time_freq_support.time_frequencies
plt.plot(time.data, signal.data)
plt.title("Xtract Demo Signal 1")
plt.grid(True)
plt.xlabel(f"Time ({time.unit})")
plt.ylabel(f"Amplitude ({signal.unit})")
plt.show()

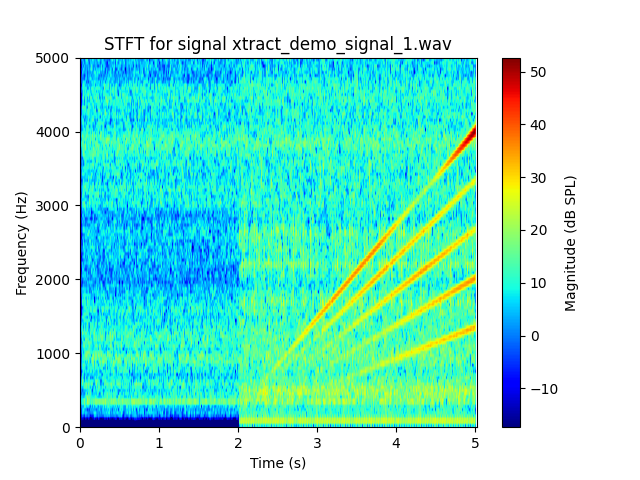
# Compute the spectrogram of the signal and plot it.
stft_original = Stft(signal=signal, fft_size=1024, window_overlap=0.9)
stft_original.process()
max_stft_dBSPL = 20 * np.log10(
    np.max(stft_original.get_magnitude()) / REFERENCE_ACOUSTIC_PRESSURE_IN_AIR
)
max_frequency_Hz = 20000.0
stft_original.plot_custom(
    display_phase=False,
    reference_value=REFERENCE_ACOUSTIC_PRESSURE_IN_AIR,
    max_magnitude=max_stft_dBSPL,
    max_frequency=max_frequency_Hz,
)
Use individual extraction features#
The following topics show how to use different capabilities of Xtract independently.
Noise extraction#
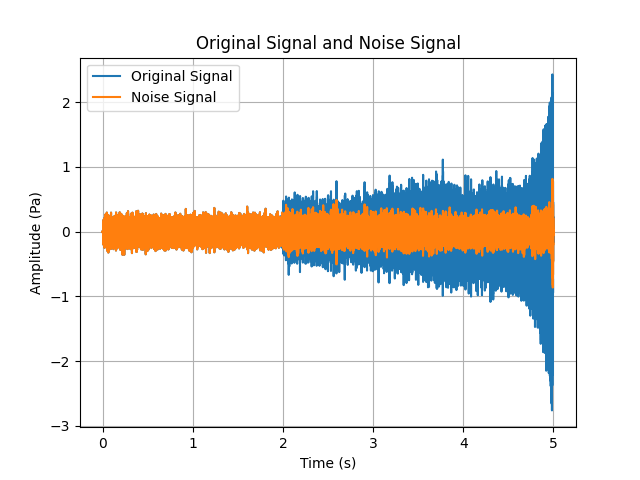
The goal is to remove the fan noise from the demo signal. For this, we first need to isolate a portion of the demo signal that only contains the fan noise, and deprived of any tonal content. Then, this serves as the basis noise pattern to remove the fan noise from the rest of the demo signal.
Crop the first two seconds of signal, where only the fan noise is present, to create the noise pattern.
signal_cropper = CropSignal(signal=signal, start_time=0.0, end_time=2.0)
signal_cropper.process()
cropped_signal = signal_cropper.get_output()
Use the XtractDenoiserParameters class to create the noise pattern from the cropped
signal.
xtract_denoiser_params = XtractDenoiserParameters()
xtract_denoiser_params.noise_psd = xtract_denoiser_params.create_noise_psd_from_noise_samples(
    signal=cropped_signal, sampling_frequency=fs, window_length=100
)
Use the noise pattern to denoise the signal using the XtractDenoiser class.
xtract_denoiser = XtractDenoiser(input_signal=signal, input_parameters=xtract_denoiser_params)
xtract_denoiser.process()

noise_signal = xtract_denoiser.get_output()[1]
Plot the original signal and the noise signal in the same window.
plt.plot(time.data, signal.data, label="Original Signal")
plt.plot(time.data, noise_signal.data, label="Noise Signal")
plt.grid(True)
plt.xlabel(f"Time ({time.unit})")
plt.ylabel(f"Amplitude ({signal.unit})")
plt.title("Original Signal and Noise Signal")
plt.legend()
plt.show()
Tone extraction#
The goal is to isolate the tones using the right tone extraction parameters.
Create a first set of tone extraction parameters with the XtractTonalParameters class.
Perform the tone extraction using the XtractTonal class.
xtract_tonal = XtractTonal(input_signal=signal, input_parameters=xtract_tonal_params)
xtract_tonal.process()
Plot the spectrograms to assess the quality of the output.
# Compute the STFT of the tone-isolated signal.
stft_modified_signal = Stft(signal=xtract_tonal.get_output()[0], fft_size=1024, window_overlap=0.9)
stft_modified_signal.process()

print("Plot of the spectrograms with tonal extraction parameters that do not work.")

# Spectrogram of the original signal.
max_frequency_Hz = 5000.0
stft_original.plot_custom(
    display_phase=False,
    reference_value=REFERENCE_ACOUSTIC_PRESSURE_IN_AIR,
    max_magnitude=max_stft_dBSPL,
    max_frequency=max_frequency_Hz,
    title="Original Signal",
)

# Spectrogram of the tone-isolated signal.
stft_modified_signal.plot_custom(
    display_phase=False,
    reference_value=REFERENCE_ACOUSTIC_PRESSURE_IN_AIR,
    max_magnitude=max_stft_dBSPL,
    max_frequency=max_frequency_Hz,
    title="Extracted Tones",
)
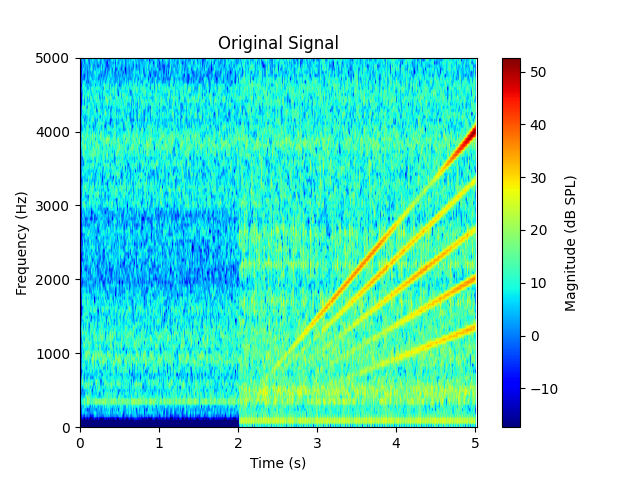
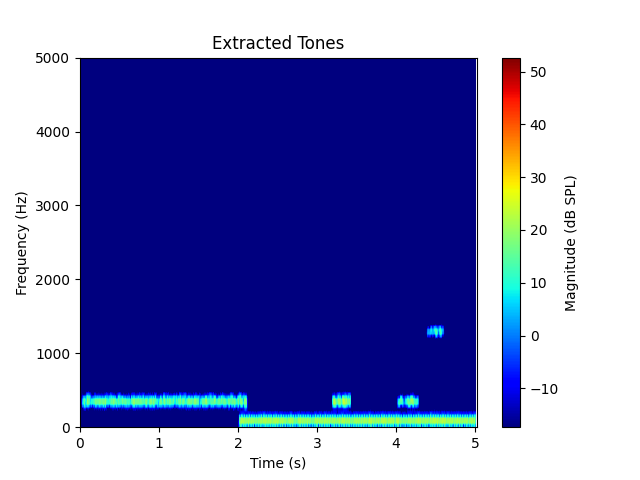
Plot of the spectrograms with tonal extraction parameters that do not work.
You can see from the obtained plots that the tones are not properly extracted, because the set maximum slope - 500.0 Hz/s - is too low compared to how fast the tone frequencies increase.
Try again with a higher maximum slope value, and check the plots again.
# Set the maximum slope to 5000.0 Hz/s.
xtract_tonal_params.maximum_slope = 5000.0
xtract_tonal.process()

print("Plot of the spectrograms with the right tonal extraction parameters.")

# Spectrogram of the original signal.
stft_original.plot_custom(
    display_phase=False,
    reference_value=REFERENCE_ACOUSTIC_PRESSURE_IN_AIR,
    max_magnitude=max_stft_dBSPL,
    max_frequency=max_frequency_Hz,
    title="Original Signal",
)

# Spectrogram of the modified signal.
stft_modified_signal.signal = xtract_tonal.get_output()[0]
stft_modified_signal.process()
stft_modified_signal.plot_custom(
    display_phase=False,
    reference_value=REFERENCE_ACOUSTIC_PRESSURE_IN_AIR,
    max_magnitude=max_stft_dBSPL,
    max_frequency=max_frequency_Hz,
    title="Extracted Tones",
)
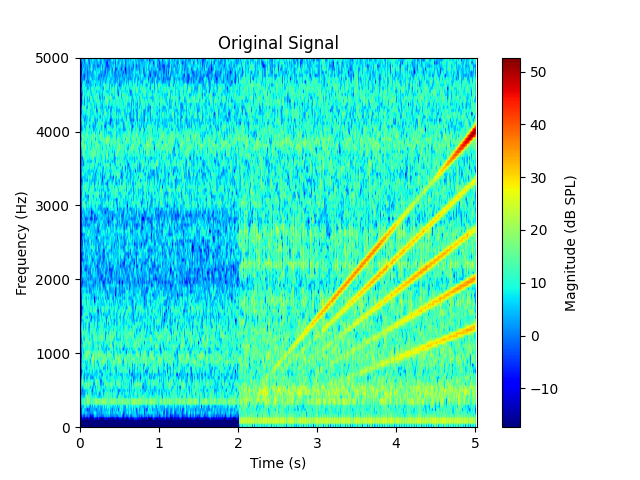
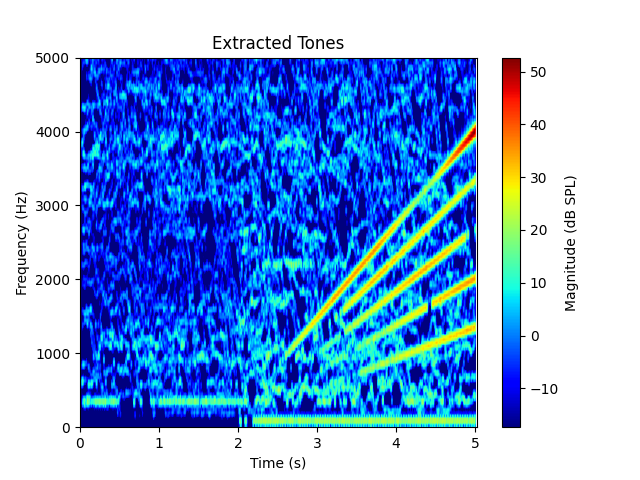
Plot of the spectrograms with the right tonal extraction parameters.
This time, the tones are properly extracted.
Transient extraction#
The goal is to isolate the transients using the right transient extraction parameters. While these parameters are not as easy to handle, they are well explained in the tutorial videos available on the Ansys Sound YouTube channel. You can also find the SAS - XTRACT transient video on the Ansys Learning Hub. This example assumes that the best parameter values are known. You can use the Ansys Sound SAS interface to help set them up interactively.
Create the set of transient parameters with the XtractTransientParameters class.
xtract_transient_params = XtractTransientParameters(lower_threshold=51.5, upper_threshold=60.0)
Perform the transient extraction using the XtractTransient class.
xtract_transient = XtractTransient(input_signal=signal, input_parameters=xtract_transient_params)
xtract_transient.process()
transient_signal = xtract_transient.get_output()[0]
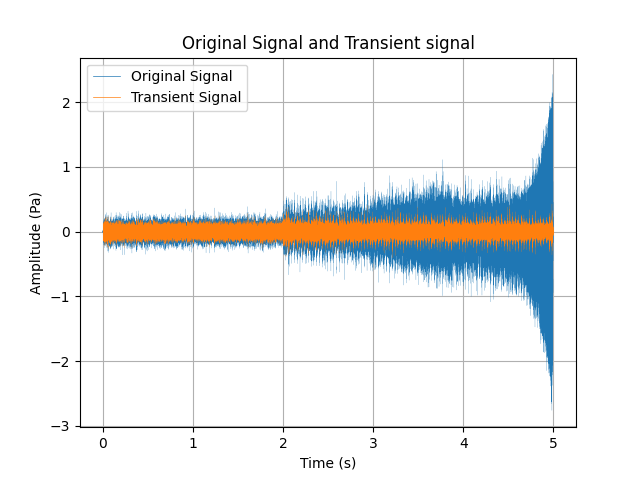
Plot the original signal and the transient signal in the same window.
plt.plot(time.data, signal.data, label="Original Signal", linewidth=0.1)
plt.plot(time.data, transient_signal.data, label="Transient Signal", linewidth=0.1)
plt.grid(True)
plt.xlabel(f"Time ({time.unit})")
plt.ylabel(f"Amplitude ({signal.unit})")
plt.title("Original Signal and Transient signal")
leg = plt.legend()
for line in leg.get_lines():
    line.set_linewidth(0.5)
plt.show()
Use a combination of extraction features and loop on several signals#
The goal here is to loop over several signals and use the Xtract class to combine
all the previously demonstrated extraction features.
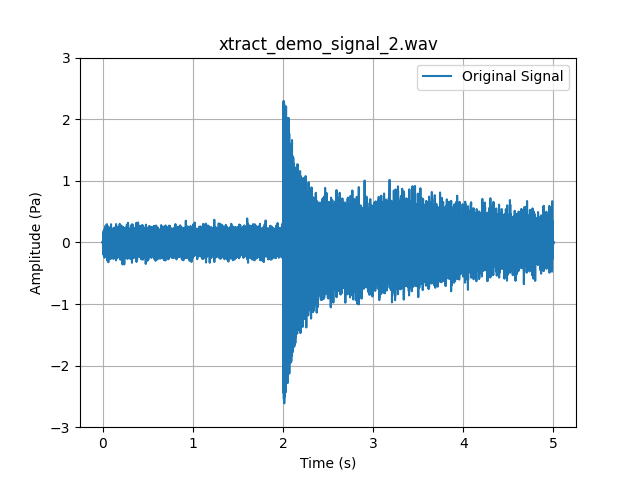
Create a list of signals to be processed with Xtract.
path_xtract_demo_signal_2 = download_xtract_demo_signal_2_wav()
paths = [path_xtract_demo_signal_1, path_xtract_demo_signal_2]
Instantiate the Xtract class with the parameters previously set.
xtract = Xtract(
    parameters_denoiser=xtract_denoiser_params,
    parameters_tonal=xtract_tonal_params,
    parameters_transient=xtract_transient_params,
)
Loop over the list of signals.
for p in paths:
    # Name the signal using the file name.
    signal_name = os.path.basename(p)

    # Load the signal.
    wav_loader.path_to_wav = p
    wav_loader.process()
    signal = wav_loader.get_output()[0]
    fs = wav_loader.get_sampling_frequency()

    # Compute and plot the STFT.
    stft_original.signal = signal
    stft_original.process()
    stft_original.plot_custom(
        display_phase=False,
        reference_value=REFERENCE_ACOUSTIC_PRESSURE_IN_AIR,
        max_magnitude=max_stft_dBSPL,
        max_frequency=max_frequency_Hz,
        title=f"STFT for signal {signal_name}",
    )

    # Apply the extraction to the loaded signal.
    xtract.input_signal = signal
    xtract.process()

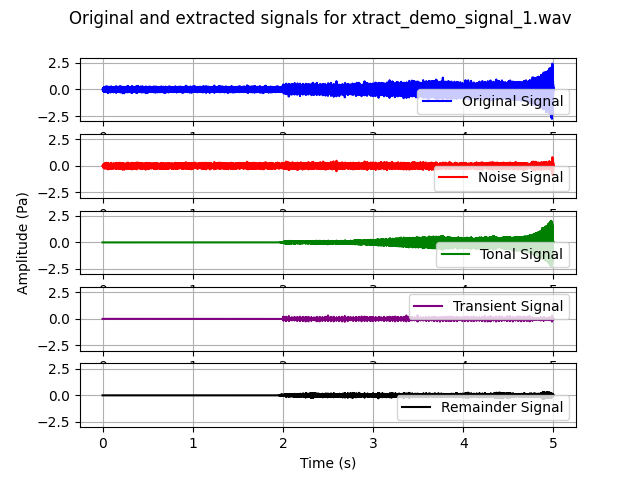
    # Collect the extracted signals and plot them against the original signal in one window.
    noise_signal, tonal_signal, transient_signal, remainder_signal = xtract.get_output()

    f, axs = plt.subplots(nrows=5)
    axs[0].plot(time.data, signal.data, label="Original Signal", color="blue")
    axs[1].plot(time.data, noise_signal.data, label="Noise Signal", color="red")
    axs[2].plot(time.data, tonal_signal.data, label="Tonal Signal", color="green")
    axs[2].set(ylabel=f"Amplitude ({signal.unit})")  # Set ylabel for middle plot only
    axs[3].plot(time.data, transient_signal.data, label="Transient Signal", color="purple")
    axs[4].plot(time.data, remainder_signal.data, label="Remainder Signal", color="black")

    ylims = [-3.0, 3.0]
    for ax in axs:
        ax.set_ylim(ylims)
        ax.grid()
        ax.legend()
        ax.set_aspect("auto")

    plt.xlabel(f"Time ({time.unit})")
    plt.legend()
    plt.suptitle(f"Original and extracted signals for {signal_name}")
    plt.show()
Total running time of the script: (3 minutes 12.284 seconds)