Note
Go to the end to download the full example code.
Calculate TNR and PR#
In the first part, this example shows how to calculate tone-to-noise ratio (TNR) and prominence ratio (PR) following the ECMA 418-1 and ISO 7779 standards. It also extracts the desired TNR and PR information and displays it in the console.
In the second part, the example shows how to calculate TNR and PR for specific orders, when the input signal is associated with an RPM profile.
Set up analysis#
Setting up the analysis consists of loading Ansys libraries, connecting to the DPF server, and retrieving the example files.
# Load Ansys libraries.
from ansys.dpf.core import TimeFreqSupport, fields_factory, locations
import numpy as np

from ansys.sound.core.examples_helpers import (
    download_accel_with_rpm_wav,
    download_flute_psd,
    download_flute_wav,
)
from ansys.sound.core.psychoacoustics import (
    ProminenceRatio,
    ProminenceRatioForOrdersOverTime,
    ToneToNoiseRatio,
    ToneToNoiseRatioForOrdersOverTime,
)
from ansys.sound.core.server_helpers import connect_to_or_start_server
from ansys.sound.core.signal_utilities import LoadWav
from ansys.sound.core.spectral_processing import PowerSpectralDensity

# Connect to a remote DPF server or start a local DPF server.
my_server, my_license_context = connect_to_or_start_server(use_license_context=True)
Calculate TNR from a PSD#
Load a power spectral density (PSD) stored as a text file and then use it to create a field that serves as an input for the TNR calculation.
# Load the PSD contained in an ASCII file. This file has two columns: 'Frequency (Hz)'
# and 'PSD amplitude (dB SPL/Hz)'.
path_flute_psd = download_flute_psd()
fid = open(path_flute_psd)
fid.readline()  # Skip the first line (header)
all_lines = fid.readlines()
fid.close()

# Create the array of PSD amplitude values.
psd_dBSPL_per_Hz = []
frequencies_original = []
for line in all_lines:
    splitted_line = line.split()
    psd_dBSPL_per_Hz.append(float(splitted_line[1]))
    frequencies_original.append(float(splitted_line[0]))

# Convert amplitudes in dBSPL/Hz into power in Pa^2/Hz.
psd_dBSPL_per_Hz = np.array(psd_dBSPL_per_Hz)
psd_Pa2_per_Hz = np.power(10, psd_dBSPL_per_Hz / 10) * 4e-10

# The TNR/PR operators require the frequency array to be regularly spaced.
# Thus, the original frequencies are interpolated to regularly spaced points.
frequencies_interp = np.linspace(0, 22050, len(frequencies_original))
psd_Pa2_per_Hz_interp = np.interp(frequencies_interp, frequencies_original, psd_Pa2_per_Hz)

# Create the input PSD field for computation of TNR and PR.
f_psd = fields_factory.create_scalar_field(num_entities=1, location=locations.time_freq)
f_psd.append(psd_Pa2_per_Hz_interp, 1)
f_psd.unit = "Pa^2/Hz"

# Create and include a field containing the array of frequencies.
support = TimeFreqSupport()
f_frequencies = fields_factory.create_scalar_field(num_entities=1, location=locations.time_freq)
f_frequencies.append(frequencies_interp, 1)
support.time_frequencies = f_frequencies
f_psd.time_freq_support = support
Create a ToneToNoiseRatio object, set the created PSD field as input, and compute the
TNR.
tone_to_noise_ratio = ToneToNoiseRatio(psd=f_psd)
tone_to_noise_ratio.process()
Print results.
number_tones = tone_to_noise_ratio.get_nb_tones()
TNR = tone_to_noise_ratio.get_max_TNR_value()
TNR_frequencies = tone_to_noise_ratio.get_peaks_frequencies()
TNR_values = tone_to_noise_ratio.get_TNR_values()
TNR_levels = tone_to_noise_ratio.get_peaks_levels()

frequency_unit = tone_to_noise_ratio.get_output().get_property("frequency_Hz").unit
bandwidth_unit = tone_to_noise_ratio.get_output().get_property("bandwidth_lower_Hz").unit
tnr_unit = tone_to_noise_ratio.get_output().get_property("TNR_dB").unit
level_unit = tone_to_noise_ratio.get_output().get_property("level_dB").unit

print(
    f"\n"
    f"Number of tones found: {number_tones}\n"
    f"Maximum TNR value: {np.round(TNR, 1)} dB\n"
    f"All detected peaks' frequencies ({frequency_unit}): {np.round(TNR_frequencies)}\n"
    f"All peaks' TNR values ({tnr_unit}): {np.round(TNR_values, 1)}\n"
    f"All peaks' absolute levels ({level_unit}): {np.round(TNR_levels, 1)}"
)
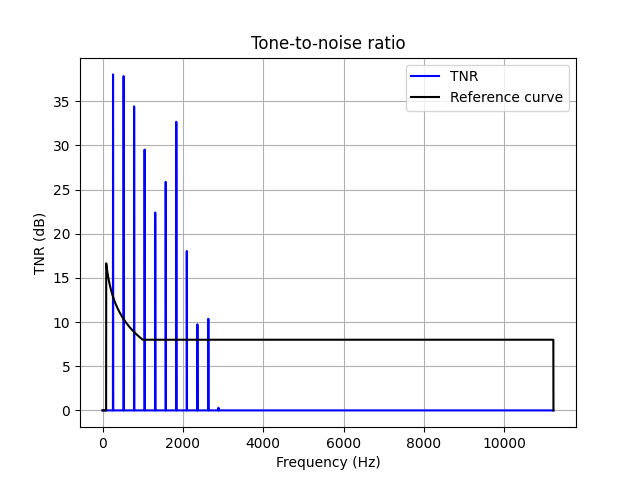
Number of tones found: 11
Maximum TNR value: 38.0 dB
All detected peaks' frequencies (Hz): [ 261.  525.  786. 1047. 1311. 1572. 1836. 2097. 2361. 2632. 2888.]
All peaks' TNR values (dB): [38.  37.8 34.4 29.5 22.4 25.9 32.7 18.   9.7 10.4  0.3]
All peaks' absolute levels (dBSPL): [71.1 79.3 76.9 68.2 62.  68.6 72.6 63.1 55.2 52.8 44.5]
Plot the TNR over frequency.
tone_to_noise_ratio.plot()

Recalculate the TNR for specific frequencies.
frequencies = [261, 525, 786, 1836]
tone_to_noise_ratio = ToneToNoiseRatio(psd=f_psd, frequency_list=frequencies)
tone_to_noise_ratio.process()
Print information for a specific detected peak.
tone_to_noise_ratio_525 = tone_to_noise_ratio.get_single_tone_info(tone_index=1)
TNR_frequency = tone_to_noise_ratio_525[0]
TNR_width = tone_to_noise_ratio_525[4] - tone_to_noise_ratio_525[3]
TNR = tone_to_noise_ratio_525[1]
print(
    f"\n"
    f"TNR info for peak at ~525 Hz: \n"
    f"Exact tone frequency: {round(TNR_frequency, 2)} {frequency_unit}\n"
    f"Tone width: {round(TNR_width, 2)} {bandwidth_unit}\n"
    f"TNR value: {round(TNR, 2)} {tnr_unit}"
)
TNR info for peak at ~525 Hz:
Exact tone frequency: 524.87 Hz
Tone width: 48.45 Hz
TNR value: 37.84 dB
Calculate PR from a signal#
Use the PowerSpectralDensity class to calculate a PSD, and compute Prominence Ratio
(PR).
# Load example data from a WAV file (recording of a flute).
path_flute_wav = download_flute_wav(server=my_server)
wav_loader = LoadWav(path_flute_wav)
wav_loader.process()
flute_signal = wav_loader.get_output()[0]
Create a PowerSpectralDensity object, set its input signal and parameters,
and compute the PSD.
psd_object = PowerSpectralDensity(
    flute_signal, fft_size=32768, window_type="HANN", window_length=32768, overlap=0.5
)
psd_object.process()
Get the computed PSD as a Field.
f_psd = psd_object.get_output()
Create a ProminenceRatio object, set the computed PSD as input, and compute the PR.
prominence_ratio = ProminenceRatio(psd=f_psd)
prominence_ratio.process()
Print the results.
number_tones = prominence_ratio.get_nb_tones()
PR = prominence_ratio.get_max_PR_value()
PR_frequencies = prominence_ratio.get_peaks_frequencies()
PR_values = prominence_ratio.get_PR_values()
PR_levels = prominence_ratio.get_peaks_levels()
print(
    f"\n"
    f"Number of tones found: {number_tones}\n"
    f"Maximum PR value: {np.round(PR, 1)} dB\n"
    f"All detected peaks' frequencies ({frequency_unit}): {np.round(PR_frequencies)}\n"
    f"All peaks' PR values ({tnr_unit}): {np.round(PR_values, 1)}\n"
    f"All peaks' absolute levels ({level_unit}): {np.round(PR_levels, 1)}"
)
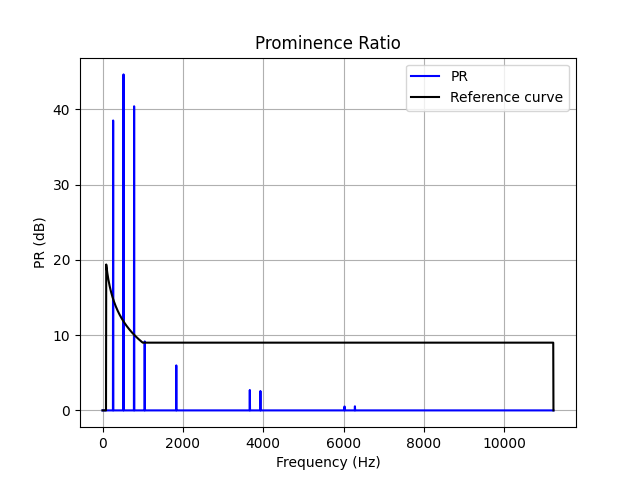
Number of tones found: 16
Maximum PR value: 45.0 dB
All detected peaks' frequencies (Hz): [  262.   525.   786.  1048.  1834.  3405.  3671.  3930.  5767.  6029.
  6288.  6543.  6806. 10209. 11168. 11211.]
All peaks' PR values (dB): [39.  45.  40.7  9.1  6.1  2.8  2.8  2.6  0.6  0.5  0.6  0.4  0.4  0.6
  1.8  1.9]
All peaks' absolute levels (dBSPL): [71.3 79.5 77.3 68.4 73.1 40.7 45.7 42.7 30.8 33.  33.9 28.4 28.7 26.2
 19.1 22.5]
Plot the PR as a function of frequency.
prominence_ratio.plot()

Recalculate the PR for specific frequencies.
frequencies = [261, 525, 786, 1836]
prominence_ratio = ProminenceRatio(psd=f_psd, frequency_list=frequencies)
prominence_ratio.process()
Print information for a specific detected peak.
prominence_ratio_786 = prominence_ratio.get_single_tone_info(tone_index=2)
PR_frequency = prominence_ratio_786[0]
PR_width = prominence_ratio_786[4] - prominence_ratio_786[3]
PR = prominence_ratio_786[1]
print(
    f"\n"
    f"PR info for peak at ~786 Hz: \n"
    f"Exact tone frequency: {round(PR_frequency, 2)} {frequency_unit}\n"
    f"Tone width: {round(PR_width, 2)} {bandwidth_unit}\n"
    f"PR value: {round(PR, 2)} {tnr_unit}"
)
PR info for peak at ~786 Hz:
Exact tone frequency: 785.96 Hz
Tone width: 68.64 Hz
PR value: 40.71 dB
Calculate TNR over time for specific orders#
Load an acoustic signal and its associated RPM over time profile and calculate the TNR for order numbers 2, 4, and 6.
# Load example data from a WAV file: this is a recording of the noise in a car cabin
# during an acceleration. Note that this file contains the RPM profile as well,
# in its second channel.
path_accel_wav = download_accel_with_rpm_wav(server=my_server)
wav_loader = LoadWav(path_accel_wav)
wav_loader.process()
accel_signal = wav_loader.get_output()[0]
accel_rpm = wav_loader.get_output()[1]
Create a ToneToNoiseRatioForOrdersOverTime object, set the input signal, the associated
RPM profile, and the orders of interest, and compute the orders’ TNR over time.
TNR_orders = ToneToNoiseRatioForOrdersOverTime(
    signal=accel_signal, profile=accel_rpm, order_list=[2.0, 4.0, 6.0]
)
TNR_orders.process()
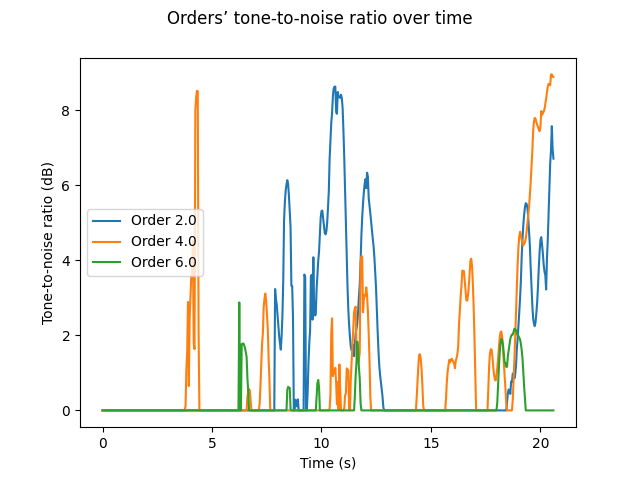
Display the TNR values over time, for the orders of interest.
TNR_orders.plot(use_rpm_scale=False)

You can then notice that order #2’s TNR is above 0 dB at around 10 s and after 18 s, order #4’s, at various times throughout the signal duration, and order #6’s exceeds 0 dB more rarely.
Calculate PR over time for specific orders#
Create a ProminenceRatioForOrdersOverTime object, set the input signal, the associated
RPM profile, and the orders of interest, and compute the orders’ PR over time.
PR_orders = ProminenceRatioForOrdersOverTime(
    signal=accel_signal, profile=accel_rpm, order_list=[2.0, 4.0, 6.0]
)
PR_orders.process()
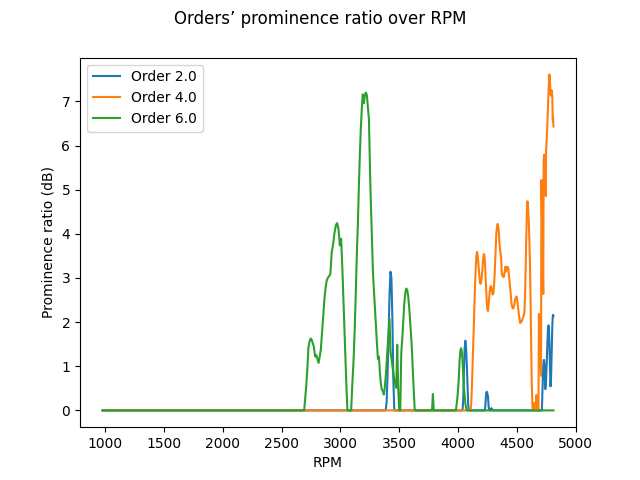
Display the PR values over RPM, for the orders of interest.
PR_orders.plot(use_rpm_scale=True)

You can then notice that order #6’s PR is above 0 dB mostly in the range 2600-3600 rpm, order #4’s, only above 4000 rpm, and order #2’s, at various RPM values above 3000 rpm.
Total running time of the script: (0 minutes 25.321 seconds)

